Recently, SteppeChange exhibited at both the Samsung CEO Summit and the Samsung Developer Conference and showed a working demo of visual and predictive analytics for Samsung ARTIK.
Samsung ARTIK is a latest end-to-end integrated IoT platform solution that – besides being a complete integrated IoT offering – stores and aggregates, transports, and brokers data between data sources.
The Demo
SteppeChange has recently created a data presentation of the Samsung ARTIK IoT Platform, which has been exhibited at the most recent Samsung events, Samsung CEO Summit and Samsung Developer Conference.
 SteppeChange at Samsung CEO Summit, image source @maria_khard
The purpose of the presentation was to showcase the applicability of IoT data for various domains. The demo focused on how the visualization of streaming data and machine learning can be used for all data types and speeds in the domain of transport and traffic analytics.
We created the simple scenario of traffic monitoring for London’s Tower Bridge.
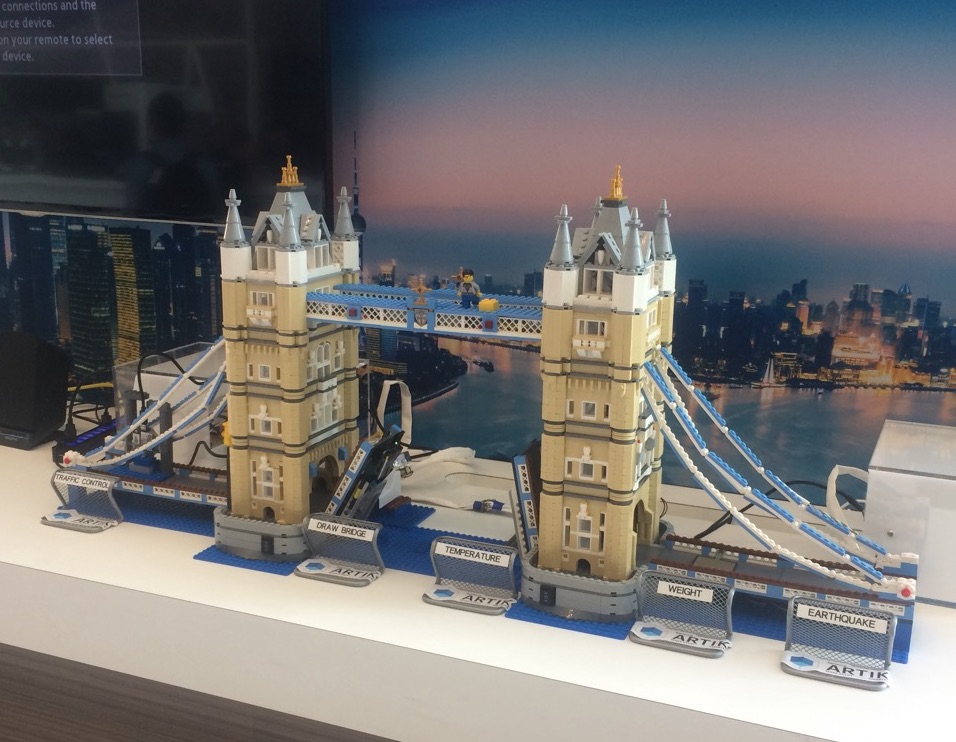 Model of the bridge
The demo comprises a layout model of the bridge equipped with ARTIK™ IoT sensors. Using this working model of the bridge (to illustrate the way in which the sensors collect data), we exhibited data visualization and data manipulation using machine learning and predictive algorithms.
The ARTIK™ team put five working sensors on the modeled bridge:
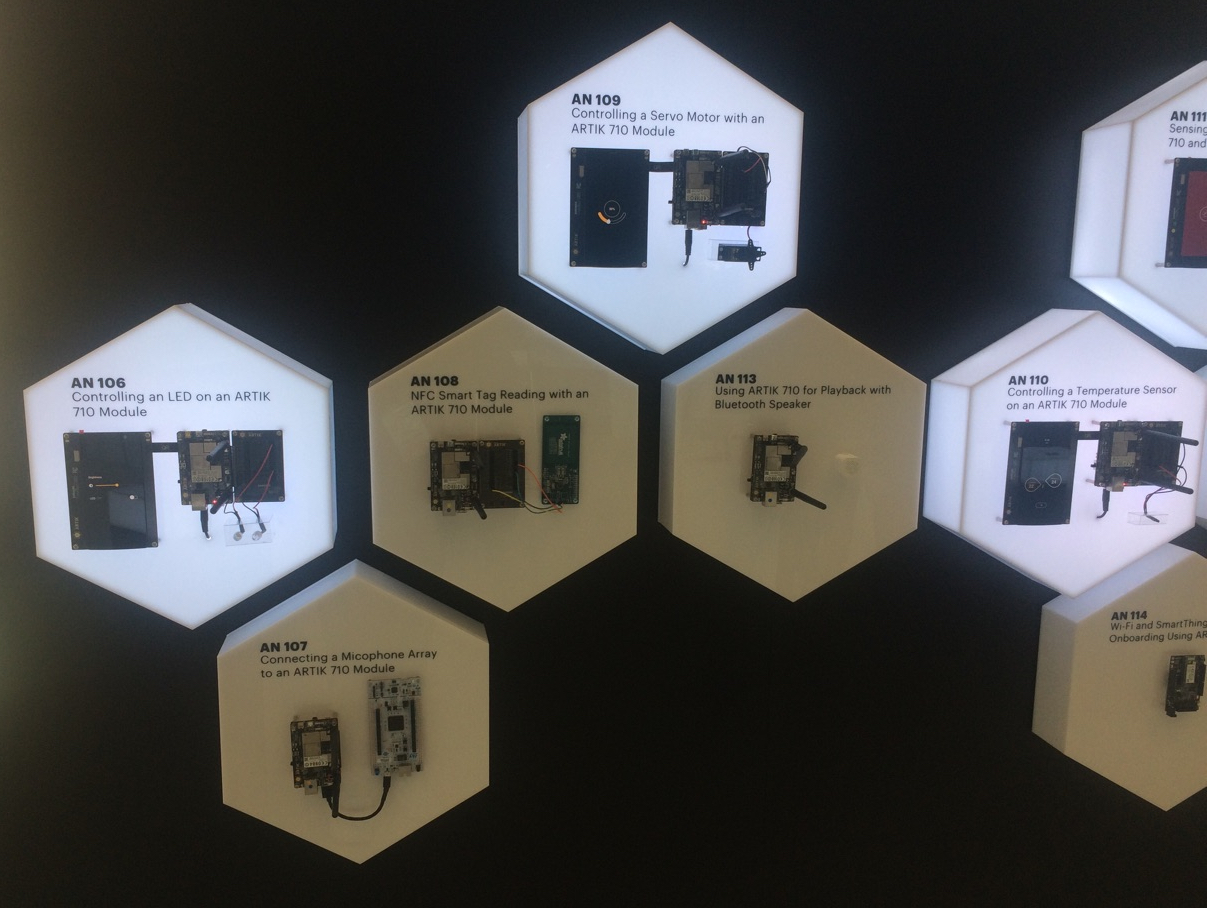 ARTIK sensors
- Temperature sensor
- Motion detector to capture the count of passing vehicles
- Sensor to measure load on the bridge
- Bridge lift indicator
- Seismic earthquake sensor
The demo depicts several use cases addressing traffic flow and predictive maintenance of the bridge.
Whilst no usable data were collected from these working sensors for use in the visualization and data manipulation exercises (obviously this was not possible, there were no passing vehicles on the modeled bridge, for example!), they could, nevertheless, be shown to be working the way they do in a real-life scenario. For example, the temperature and bridge-lift sensors could be shown to be correctly registering the temperature of the exhibition halls and whether the bridge was raised or closed. Passing a finger in front of the motion detector registered in the same way a passing vehicle would have done on the real bridge
For the purpose of the data visualization and data manipulation demonstrations, we selected publicly available datasets coming from the real Tower Bridge. The temperature, vehicle-traffic volume, bridge-lift time and bridge-load data used in the demonstration exercise are based on real data collected over a prior six-month period. These data sets were collected from sources as diverse as the London Tourist Bureau (which collects bridge raising and closing times) to research projects collecting bridge-load data.
By blending these data, we performed analysis, accompanied by powerful visualization, to highlight key relationships, to spot anomalies, and to diagnose problems.
Traffic diagnostic analytics
Multiple use cases in the demo explore traffic diagnostic analytics – to rapidly discover patterns and relative variable importance for smart traffic management scenarios.
Traffic Events over Time – Aggregated and Non-aggregated views
The graphs in the example below represent the visualization of all data, with the exclusion of seismic sensor data. Such descriptive visualization is vital and fundamental to enabling data scientists to investigate new or unknown datasets.![]()
![]()
![]()
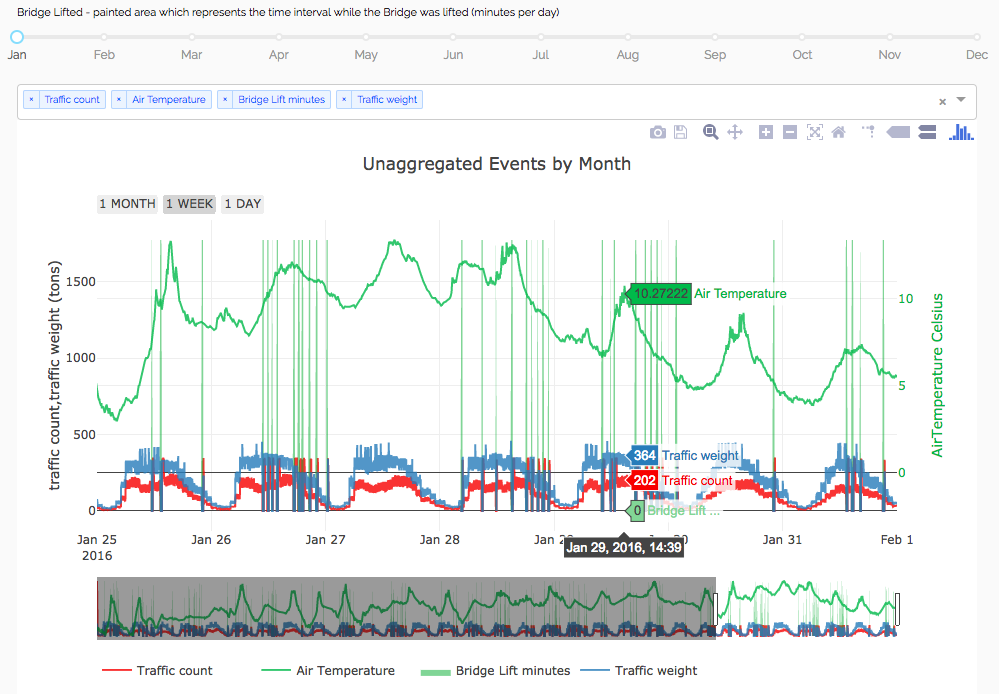
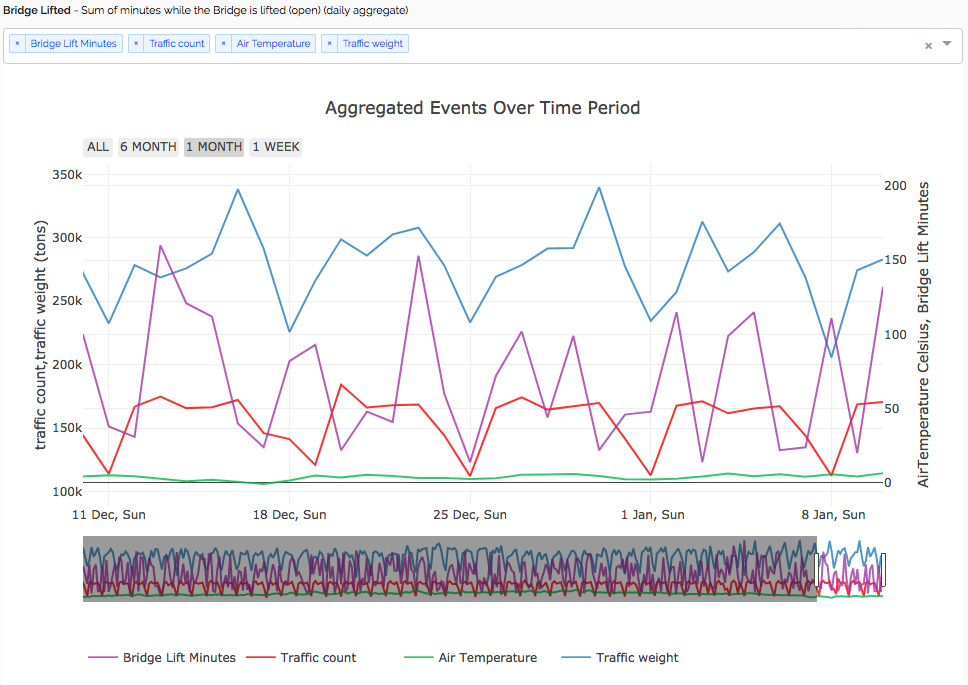
Time series data, shown on both graphs, were aggregated on a daily basis. The insight is represented either as a sum of values (traffic, load, lift minutes) or as averages (temperature).
This scientific representation of time series data enables insightful understanding of diverse traffic behavior scenarios. It helps to identify hidden patterns in data, to explore key relationships, to spot anomalies, to test hypotheses, and to diagnose problems.
For example, the analysis of time series sensor data enables us to create traffic jams’ patterns and understand whether they are natural and or not.
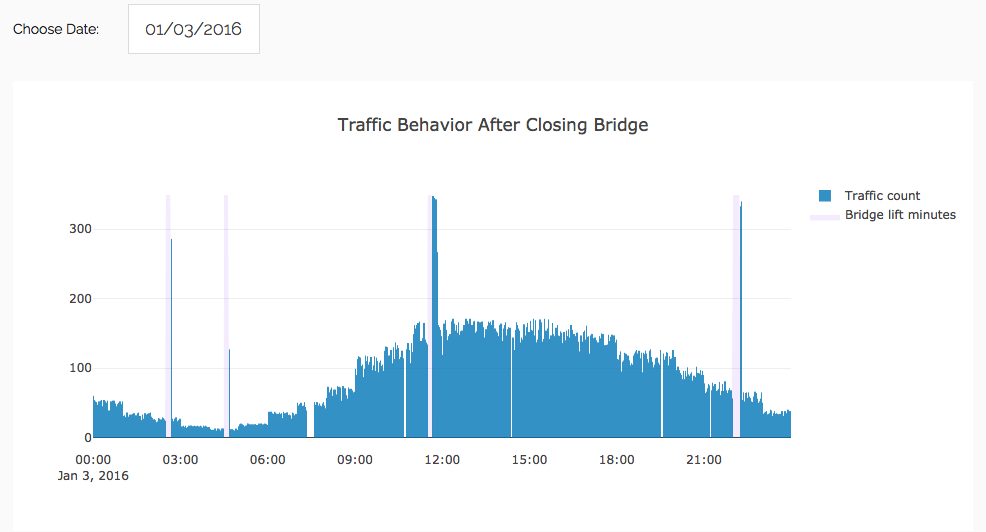
Traffic behavior during the bridge lifting
The example below shows how the bridge lifting affects traffic over the river. A pattern, clearly visible on the graph, is the congestion during the bridge lift and a fast dissolution of traffic after the bridge is closed.
One interesting observation is bridge capacity: the maximum number of vehicles that can cross the bridge simultaneously. Per our observation, that capacity is around 325 vehicles per minute. Hence, when the bridge is closed, and the roadway is down, it takes a few minutes for the accumulated traffic to pass through the bridge before it returns to a normal flow.
This maximum is an important consideration for traffic planning – for example, for an event where a high-volume of traffic is expected (such as a football game) or for contingency planning for an emergency (such as an earthquake).
Detailed analysis of the traffic behavior after closing and opening of the bridge can help identify lift schedule efficiencies. Predictive modeling enables to identify the relationship between different aspects of traffic behavior (in case of using time series form of data) and other sensors data.
Correlations and predictions
We used machine-learning algorithms to explore the relationship between sensors and to investigate how changes to one data variable affect the other variables.
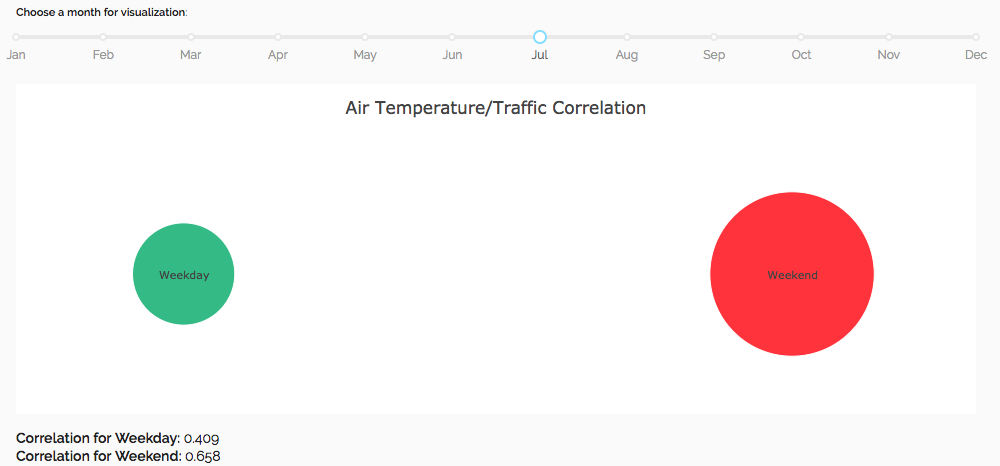
This example uses the power of correlative analysis to demonstrate how the difference in air temperature (weather) affects traffic on weekdays vs. weekends.
For example, on a hot summer weekend more people are going out of town.
Combining sensor data with other data sources can create much more value and provide much greater insight.
To demonstrate this, we’ve used the statistics of vehicles crossing the bridge counted manually split by vehicle type. We have built a deep learning AI model, solely based on sensor data, predicting total traffic distribution by a vehicle type.
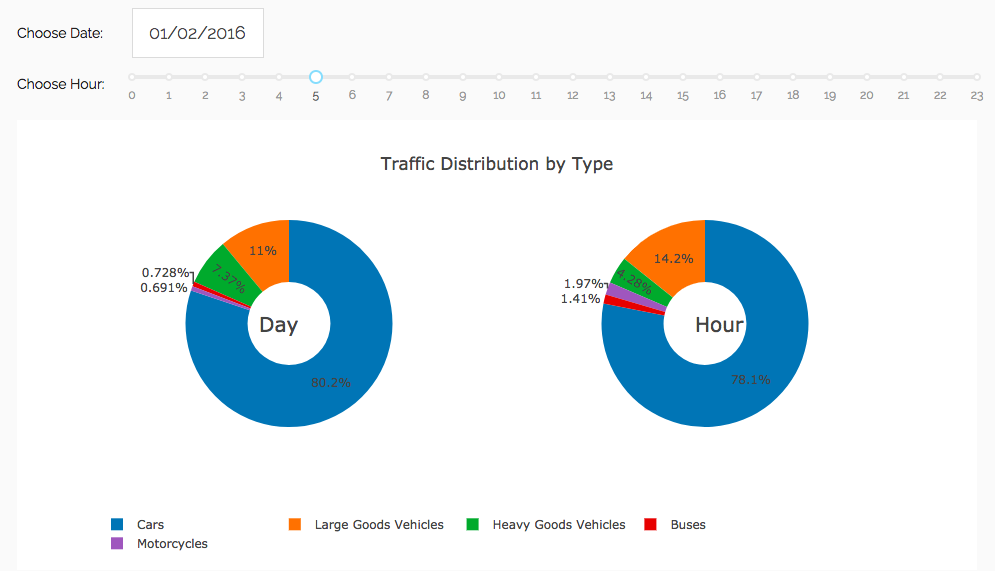
This allows us to detect types of vehicles crossing the bridge – with great precision and at any level of granularity (up to 1 hour).
Another remarkable feature of the time series data is its applicability for predictions.
In the case depicted below, by using AI algorithms such as ARIMA and Neural Nets we performed an analysis predicting the hourly traffic for the next year – at the same high level of precision.
Then, combining this prediction with the AI algorithm from the previous case (distribution of total traffic by a vehicle type) we computed an average weight for each vehicle type.
At the end, we generated a traffic forecast on the bridge for next year and an estimate of the bridge weight load on an hourly basis.
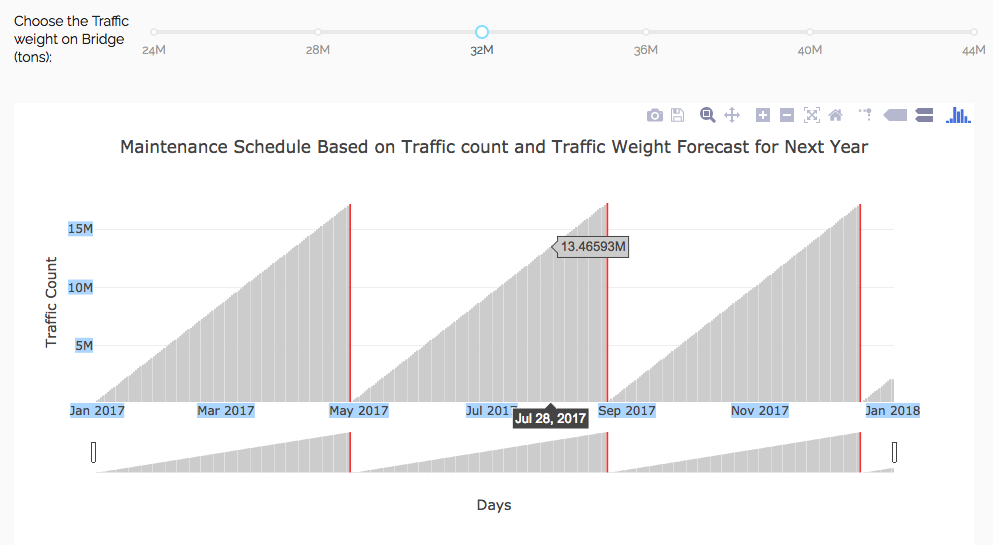
There are many potential uses for this data, and we demonstrated one of them. For example, the bridge weight information is clearly valuable for bridge maintenance optimization.
Dashboard
The demo features a real-time analytics dashboard helping to monitor the traffic situation on the bridge proactively, comparing it with the expected vs. average values.
Powered with AI algorithms on the back end, it enables us to compare and investigate different scenarios and parameters over time. Finding faults, detecting unexpected behavior, and acting on it – these are just some areas of application.